Redesigning a workout data experience to feel clearer, deeper, and more motivating.
+110%
Activity Details page usage
+30%
Overall app usage
+15%
App revisits
500
New Pro signups in week one
Wahoo was investing more heavily in the app experience, and Activity Details sat at the center of that shift. For many users, this was the destination after a workout, the place where they came to review performance, interpret effort, and decide what to focus on next.
I led the redesign of Activity Details to make the experience more useful across a wide range of users. Users had access to a broad set of workout metrics, but the existing experience made the insights harder to understand and navigate.
The challenge
Create an experience that feels clear enough for casual users and deep enough for athletes who want more.
What began as a redesign quickly became a broader product question about clarity, motivation, and depth.
Making performance data worth returning to
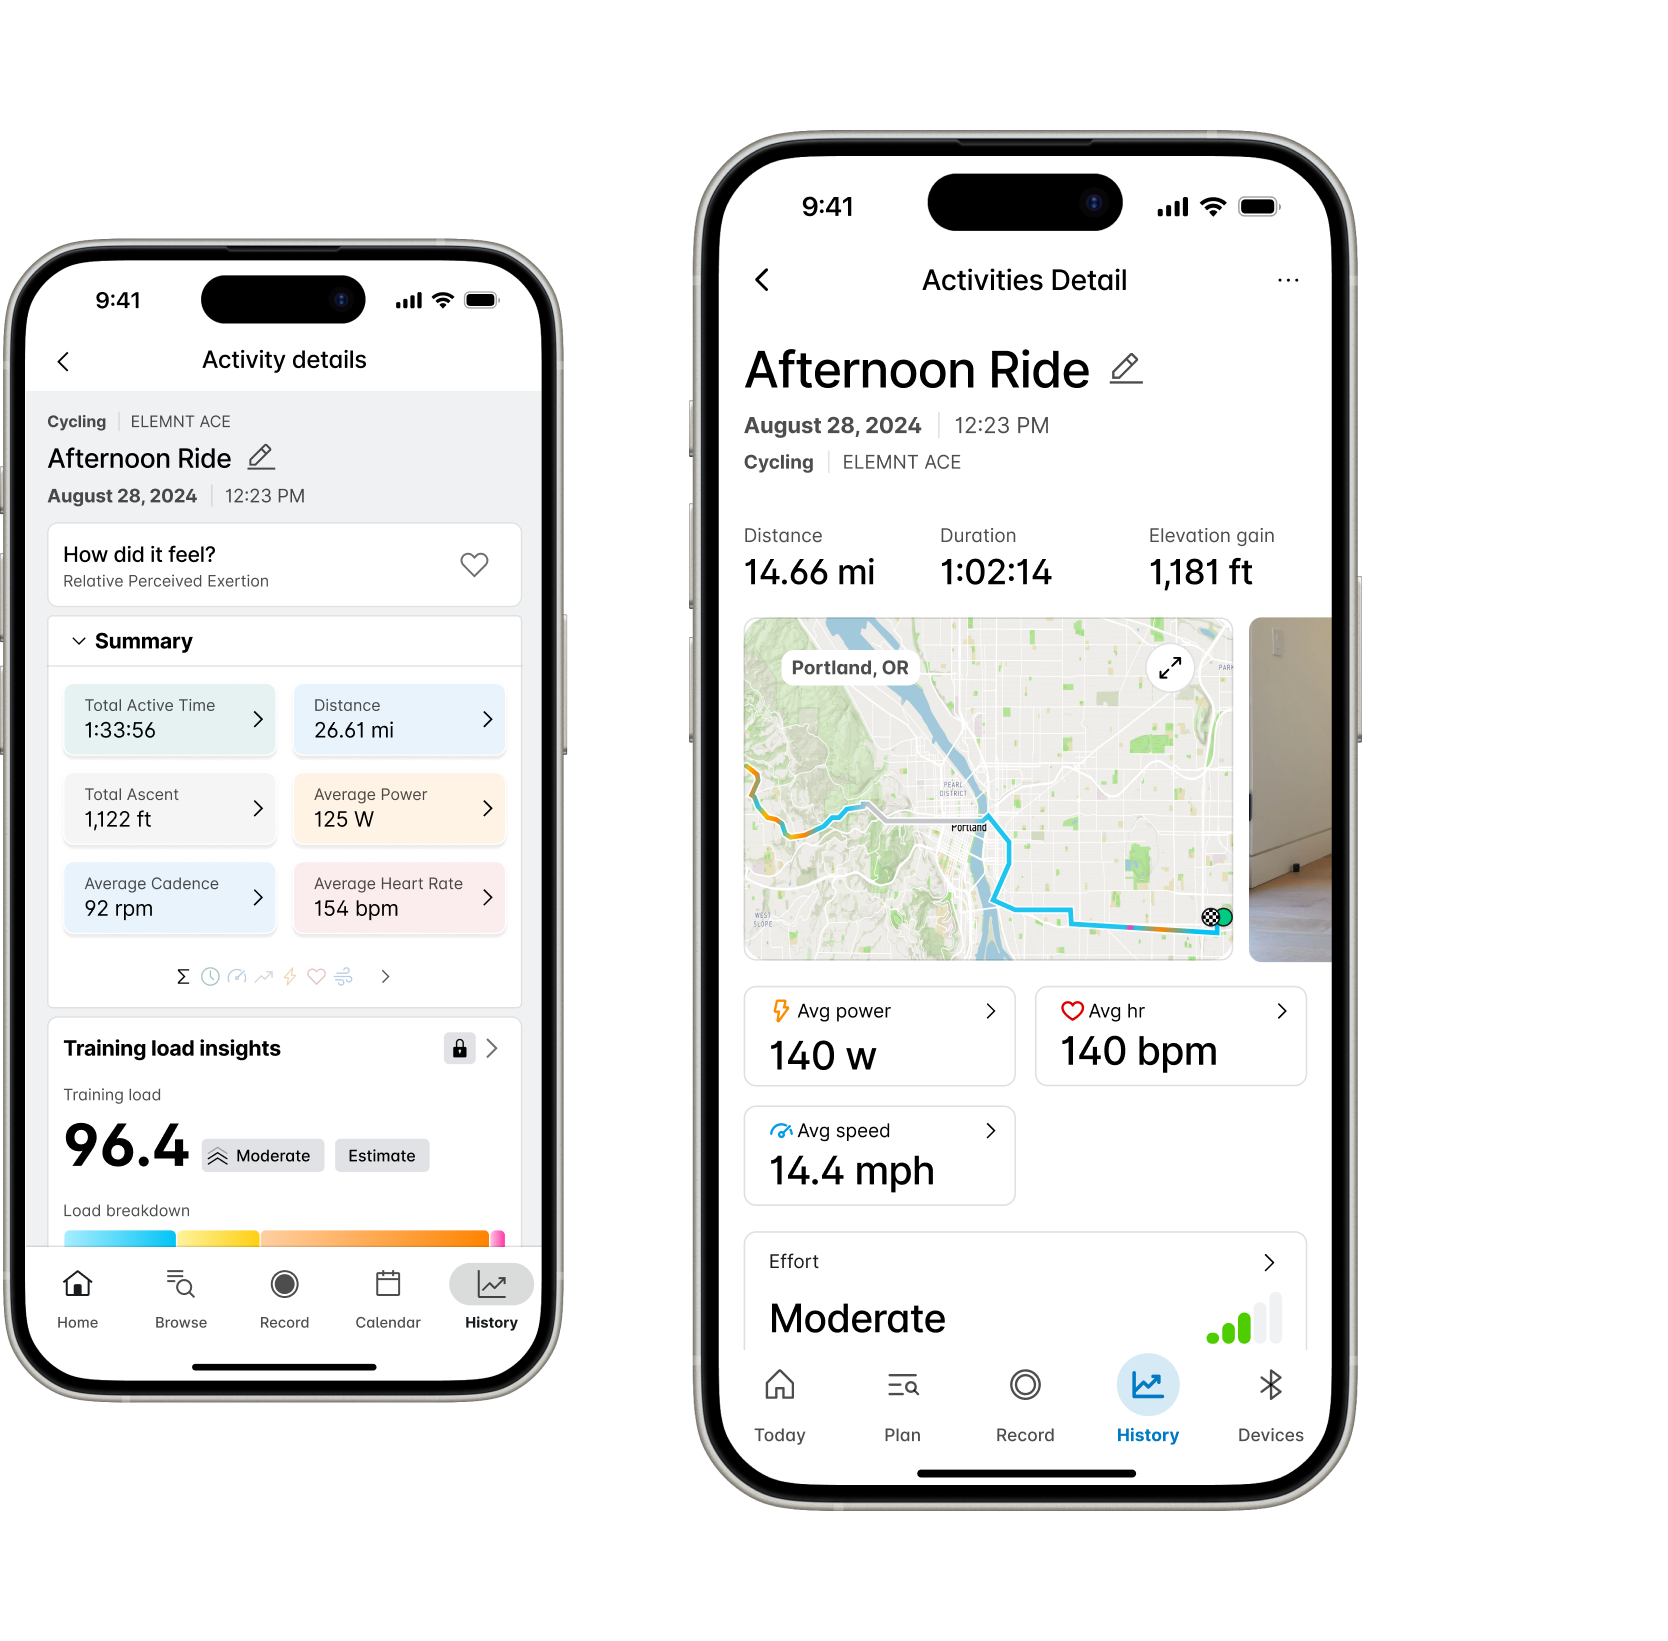
The existing Activity Details experience felt dated, dense, and difficult to navigate. Important data was available, but not always legible. Users could access workout metrics, but they often had to work too hard to understand what mattered. At the same time, the business was moving toward a more app-centric product strategy. Activity data had the potential to become both a daily value feature and a stronger premium touchpoint.
The opportunity
Turn Activity Details from a passive reporting screen into a product experience users would actually want to return to.
What research made clear
Research made one thing clear quickly: there was no universal definition of "important" data. For some users, high-level metrics at a glance were all they needed. For others, deeper exploration and comparisons mattered.
Data relevance was highly personal
Users had different priorities, which meant the experience could not treat every metric as equally important or equally visible.
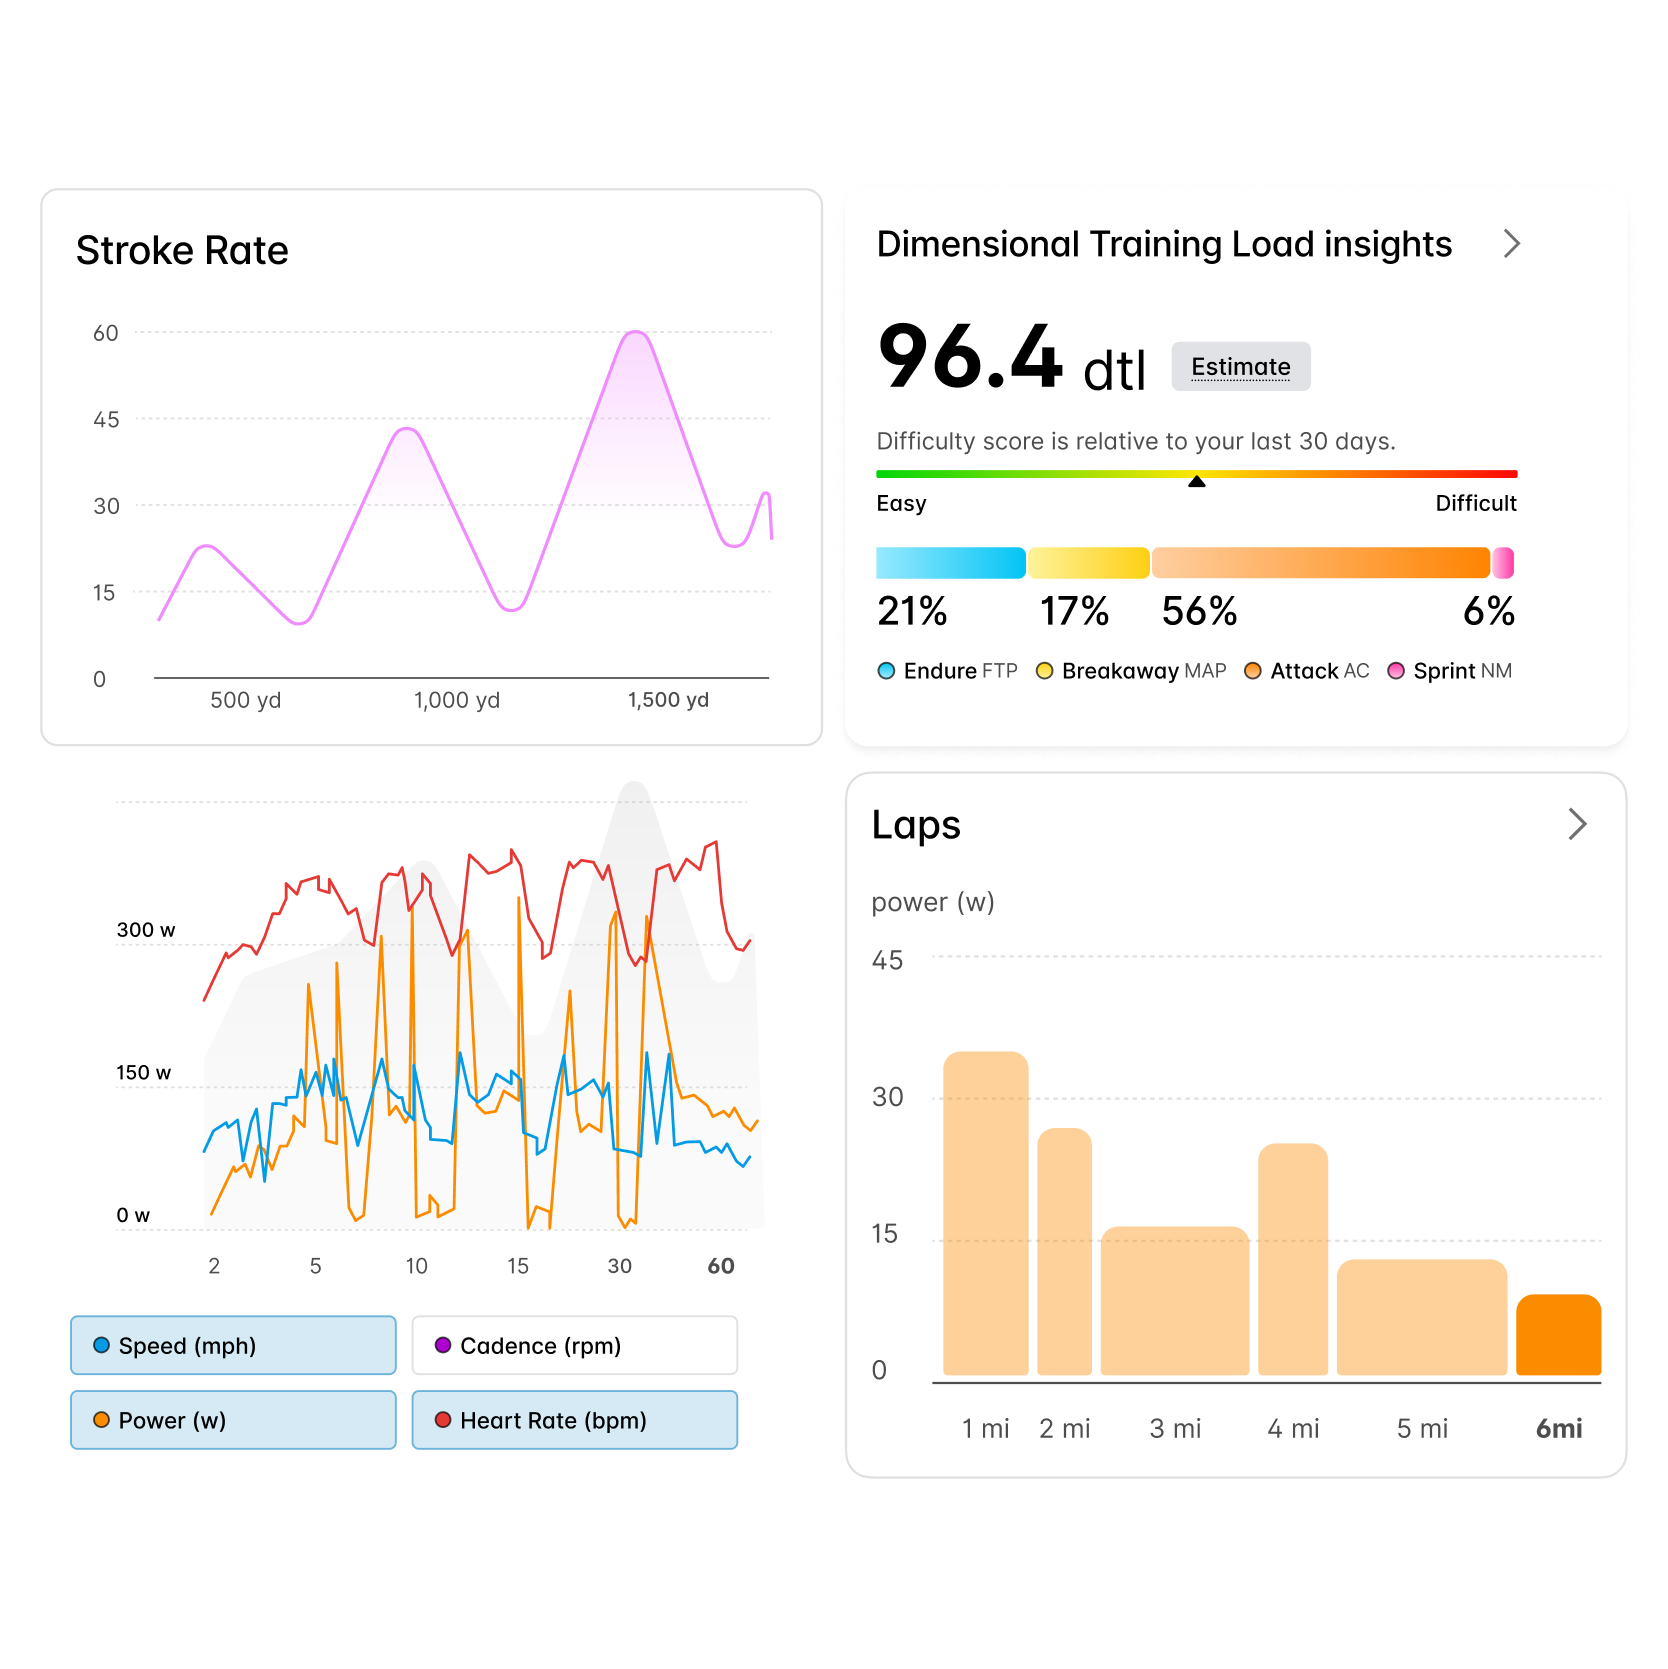
Charts outperformed raw numbers
Users consistently responded better to visual summaries than dense numerical displays. Charts made data easier to parse and more compelling to explore.
Activity Details was a destination feature
Many users were opening the app specifically to review their workout metrics. This wasn't secondary functionality; it was a core reason to return.
Casual users were pushed away by jargon
Technical language created friction for people who still wanted insight, but not necessarily expert-level analysis.
The decision that mattered most
The most consequential design question wasn't "which chart" or "which layout" - it was how much data to show immediately versus how much to make available for deeper exploration. Treat the surface as a dashboard and you overwhelm casual users; treat it as a greeting card and you drive athletes away.
Three directions were considered:
Option A - Full dashboard on first open
All metrics visible at once. Scored well with power users; casual users dropped off before the fold.


Option B - Minimal recap with a separate detail screen
Cleaner first impression, but shifted every deeper interaction into a second navigation step. Lost the browsing behavior research had identified as a core return reason.
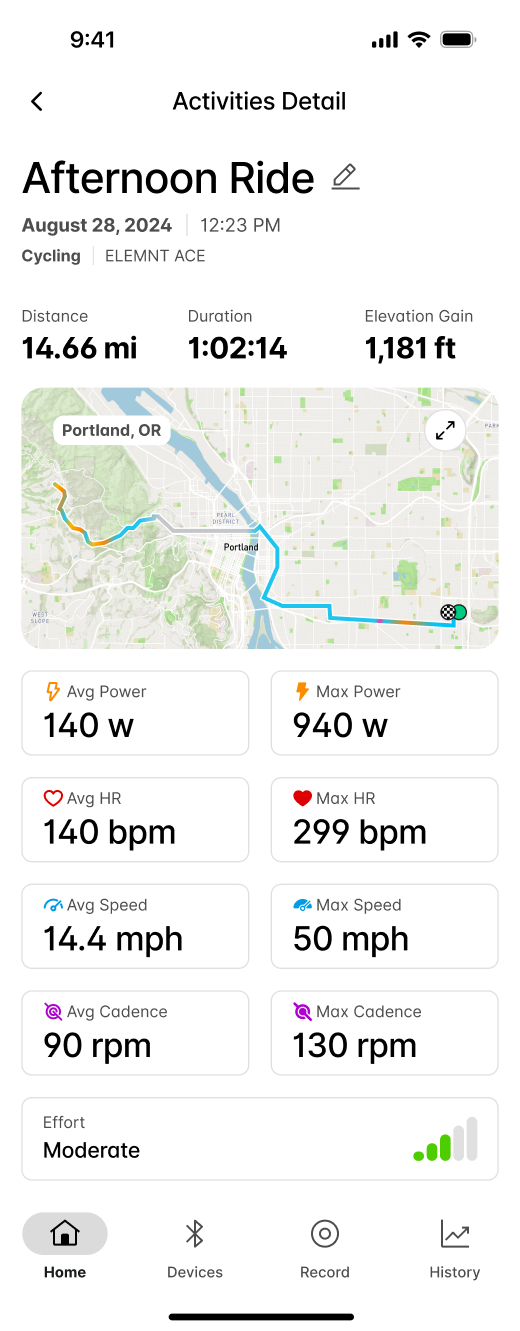
Option C - Progressive depth on one surface (chosen)
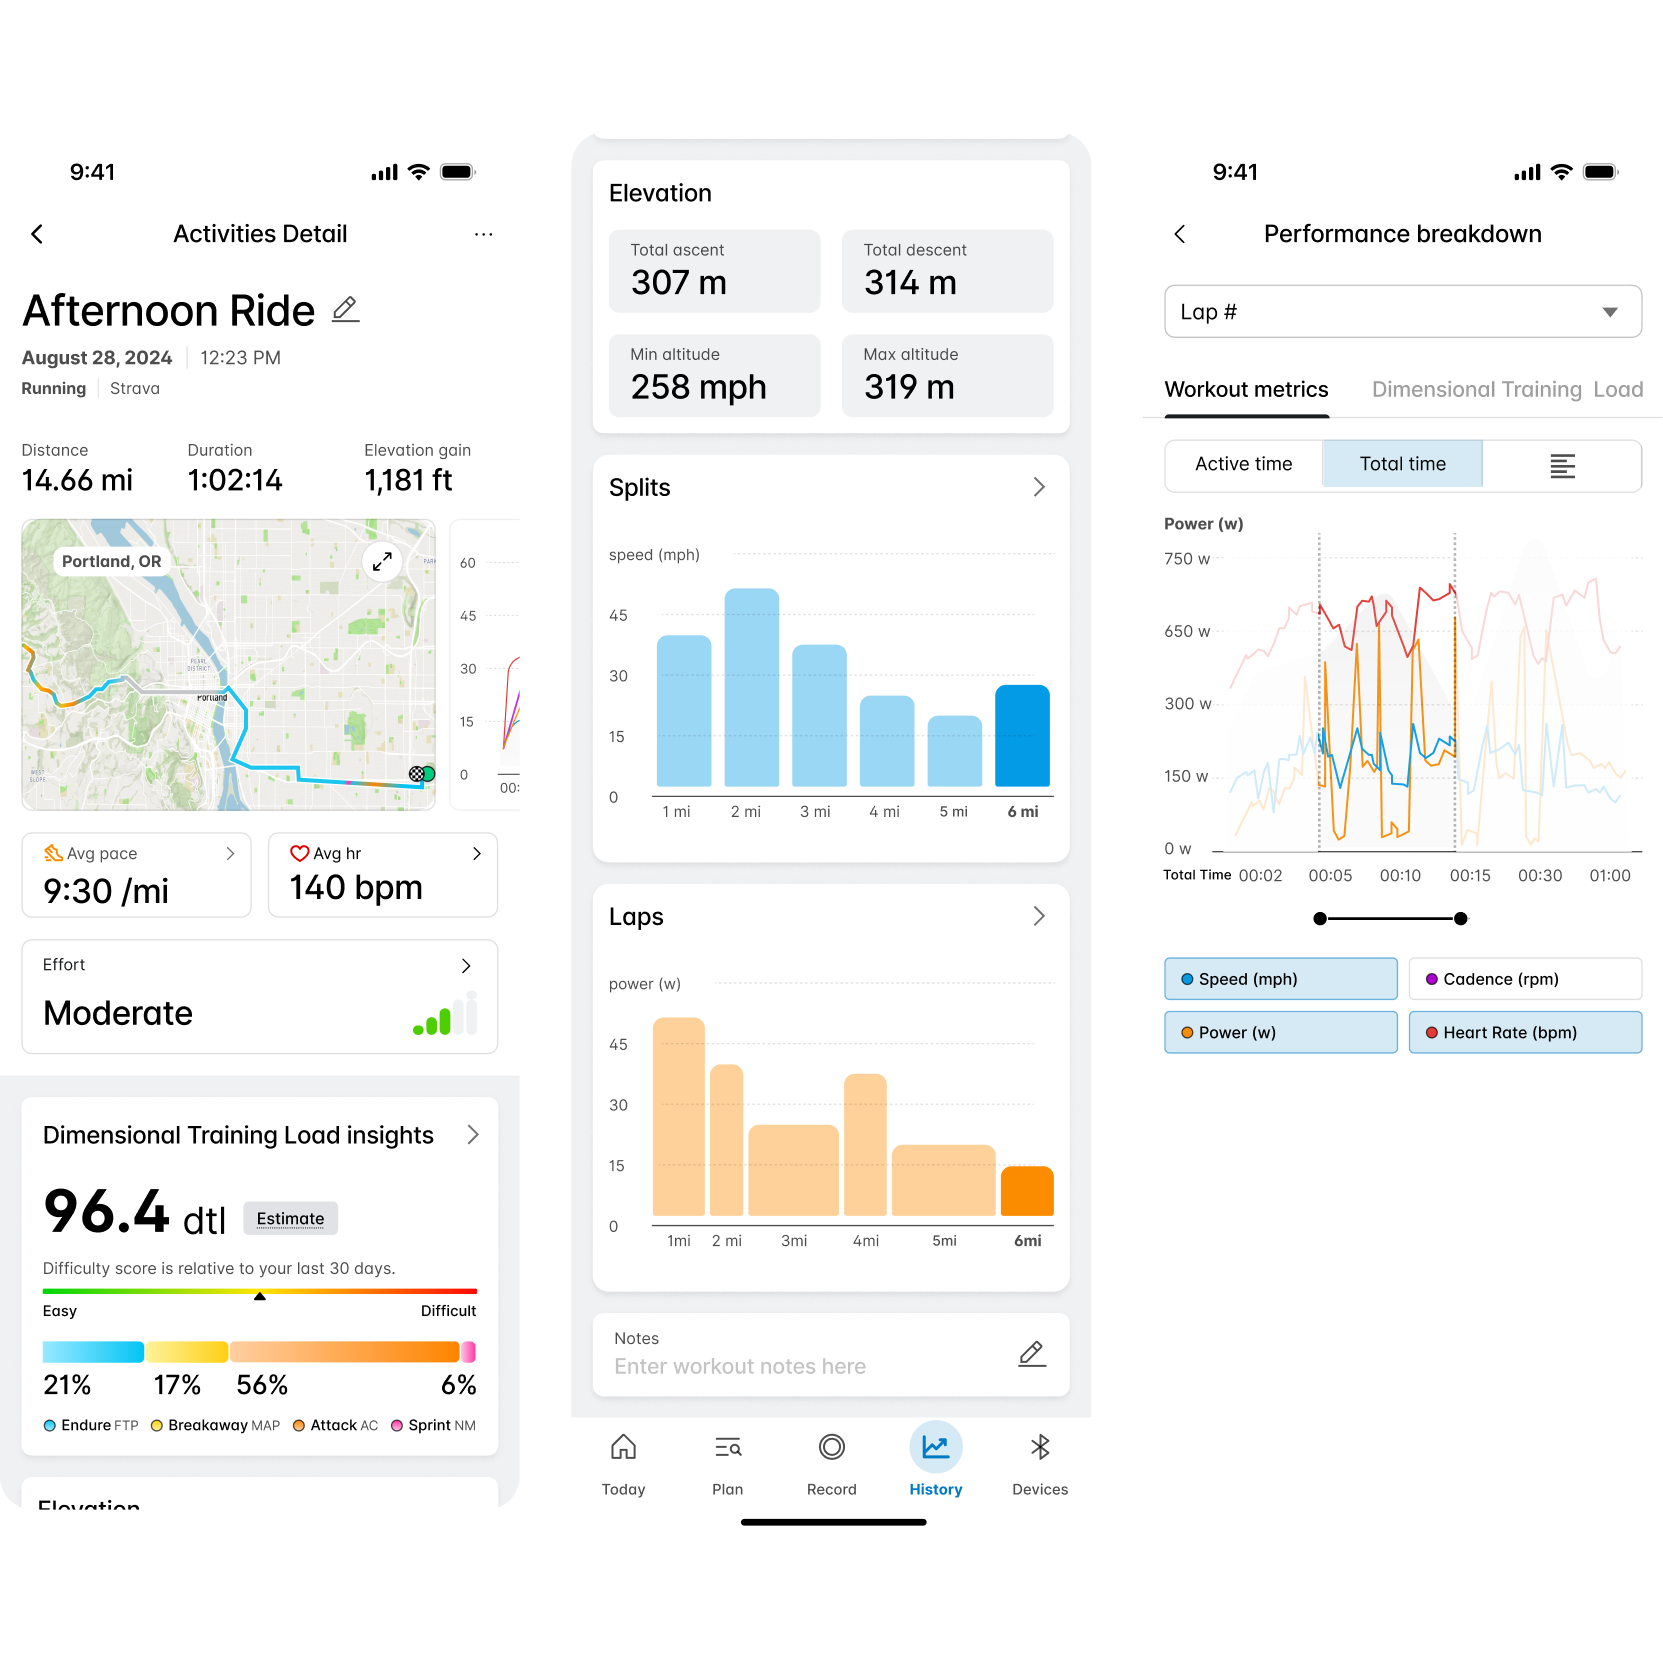
A legible top-line recap, then charts below the fold as a natural entry into deeper exploration. Supported both audiences on the same screen without forcing a mode switch.

Option C won because it respected both behaviors without duplicating the experience, and because the research showed users already scrolled past the fold when they wanted more - the design simply made that path intentional.
How the experience took shape
1. A clearer recap
I redesigned the recap layer to feel faster, cleaner, and easier to understand. The new structure emphasized top-line metrics first, giving users a concise summary of the workout before introducing deeper views. This created a more legible entry point across user types and gave the page a stronger narrative flow.
2. A more intentional return moment
I introduced a first-open post-workout experience that recognized when a user returned to the app after finishing a session. Instead of dropping users back into the product without context, the app treated that return as a meaningful moment. We used it to surface the workout recap more intentionally and added contextual prompts like "How did that workout feel?" to support quick reflection and lightweight analysis.
3. Charts as the doorway to depth
Charts became a central part of the redesign, but they were placed deliberately below the fold. This is where users tended to spend more time once they moved beyond the recap, so charts became the entry point into deeper exploration and past-workout comparison.
4. Progressive depth
A core design decision was to separate entry point from exploration. The surface experience focused on high-level understanding. Deeper layers supported users who wanted to inspect more nuanced metrics or compare performance over time. This allowed the product to support different types of engagement without making the initial experience feel bloated or overly technical.
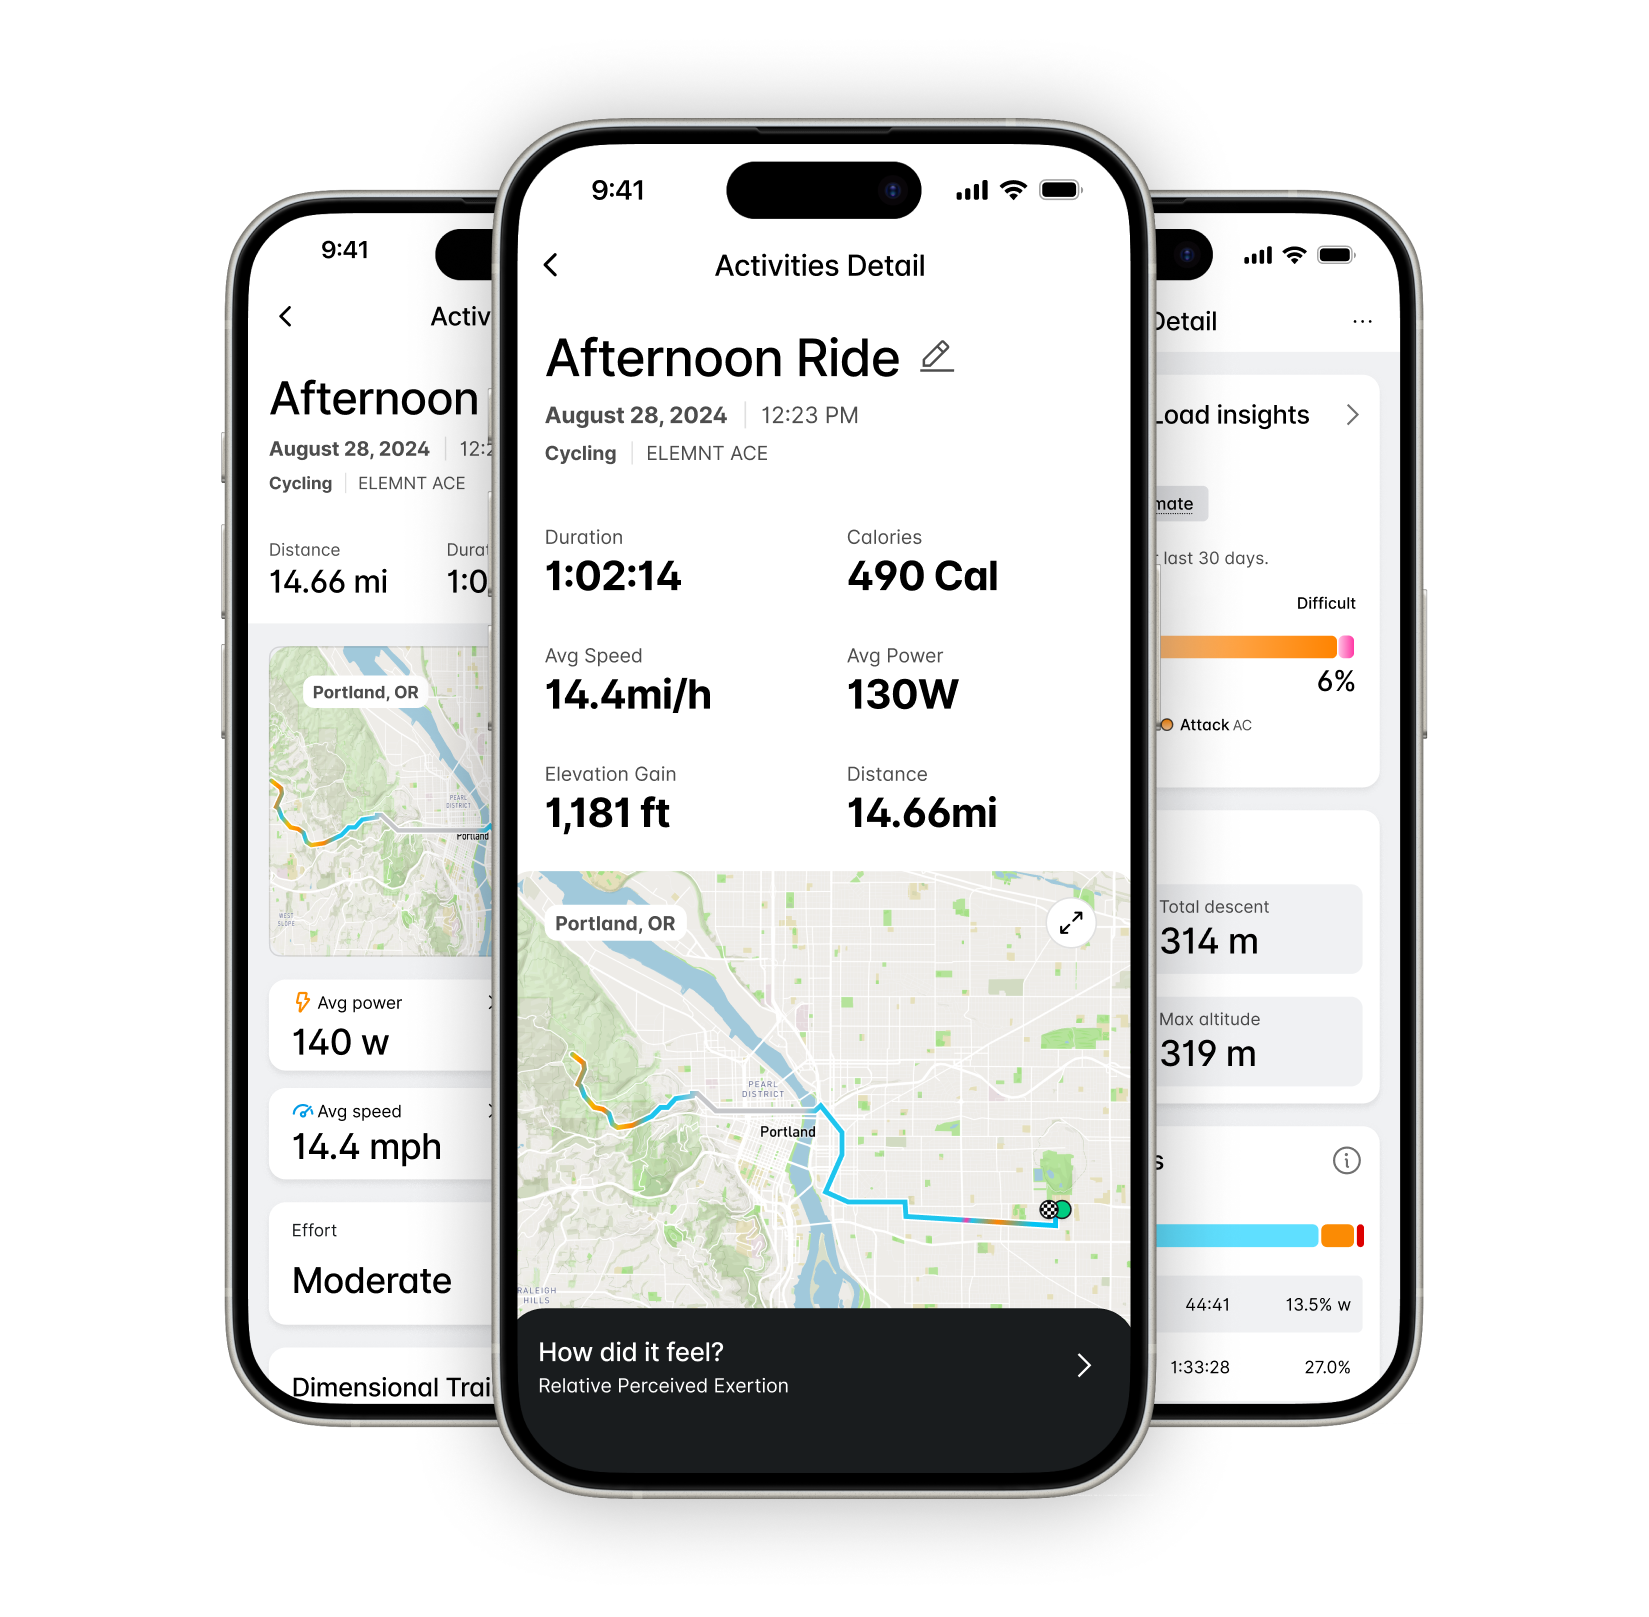
Release and what changed
The redesign shipped with the new recap layer, the first-open post-workout experience, and the chart-driven detail path. Engineering and product partners instrumented the surfaces so we could compare behavior before and after.
The outcomes at the top of this page reflect the first measurement window following release.
Role
Product Design Lead
UX/UI Designer
Team



Duration and date
6 Months
July - December


Let's Connect
I'm a lover of people, just saying Hi would do more than you think.
As a product designer, I'm on an exciting journey to blend creativity with technology to craft memorable user experiences.
powered by