Overview
Wahoo was investing more heavily in the app experience, and Activity Details - the screen users land on after every workout - sat at the center of that shift. For many riders and runners, it decided whether the ride had been worth it. The existing design made that moment feel like a wall of numbers.
I led the redesign end to end: research, concept, visual, and shipping partnership with iOS and Android. The goal was to make the post-workout experience clear enough for a casual rider to feel rewarded, and deep enough for an athlete who wanted to inspect every lap.
The challenge
A dense data screen that overwhelmed casual riders and still frustrated power users who wanted more depth in one place.
What I found
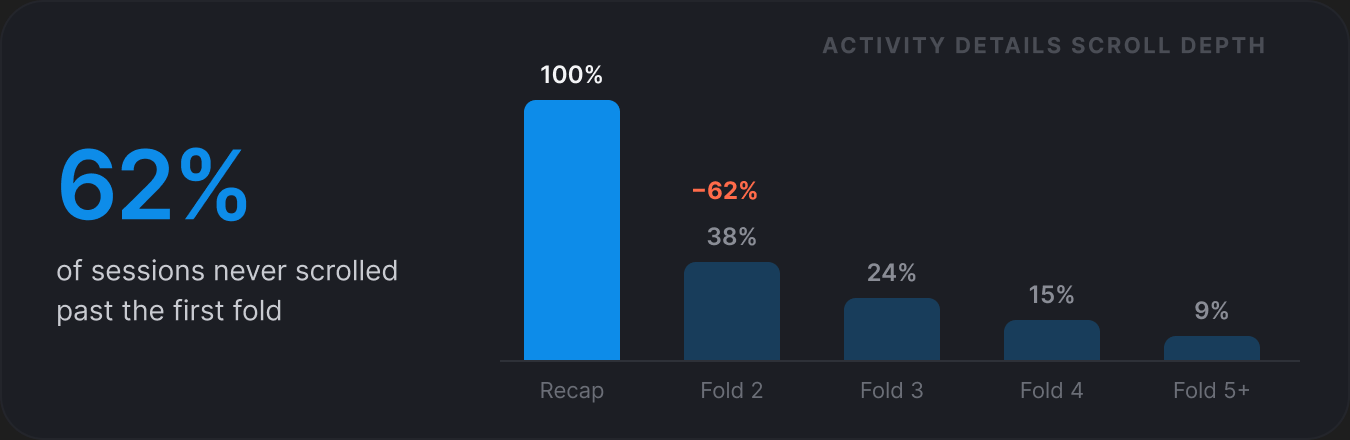
Users scrolled past the top metrics looking for charts. Casual riders bounced before the fold. Jargon kept new users at arm's length.
What I designed
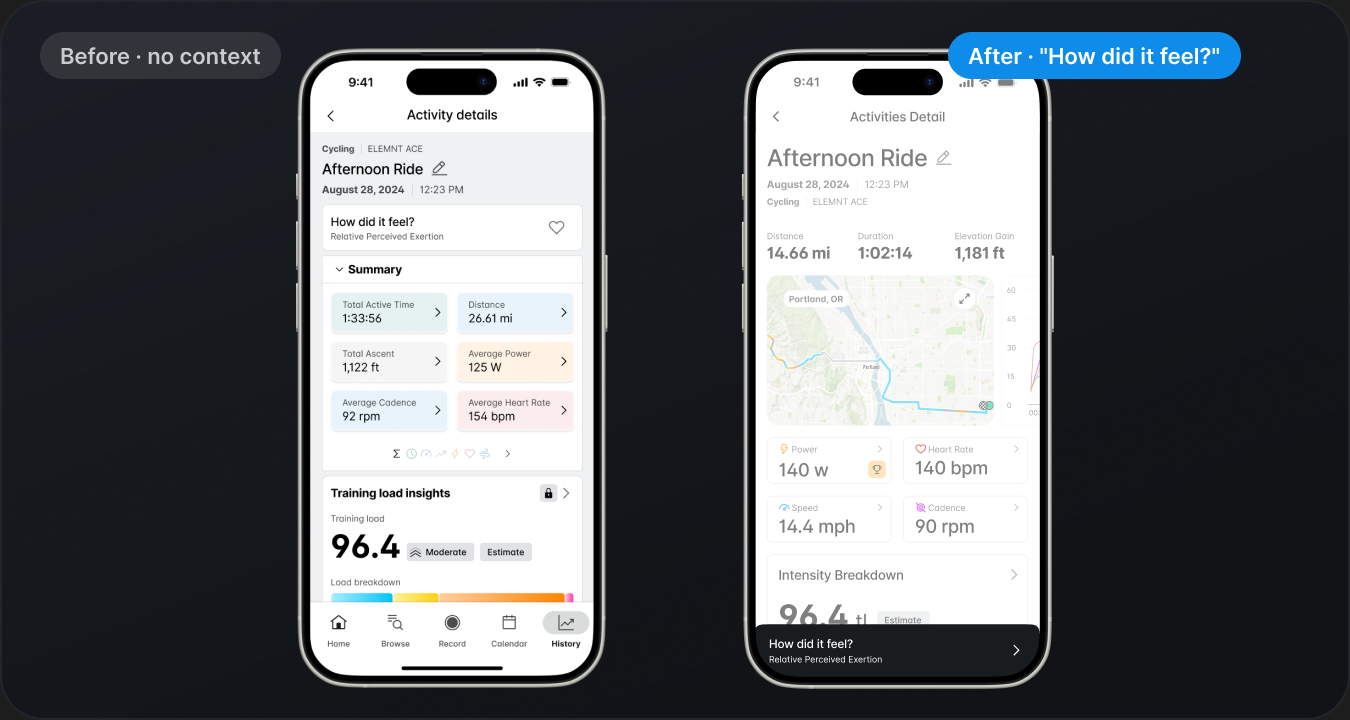
A recap-first layout that pushed depth into charts below the fold, plus a post-workout return moment that greeted users with their ride.
The result
+110% Activity Details usage, +30% overall app usage, +15% revisits, 500 Pro signups in week one.
Key screens
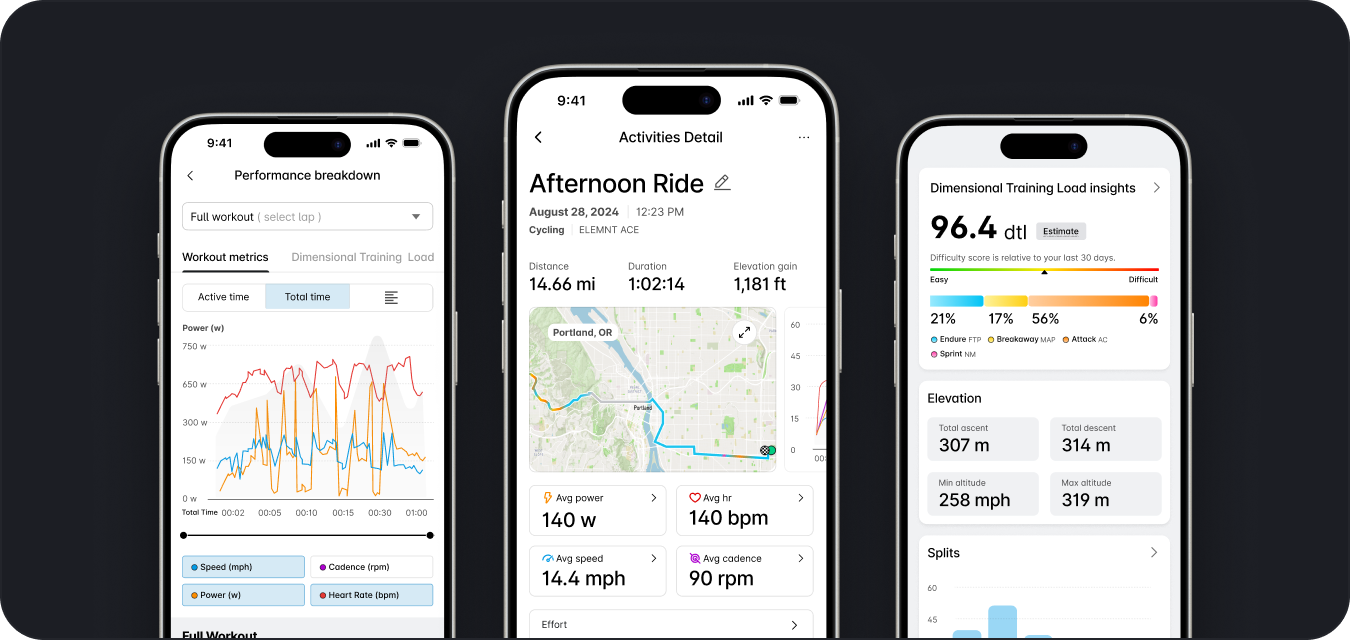
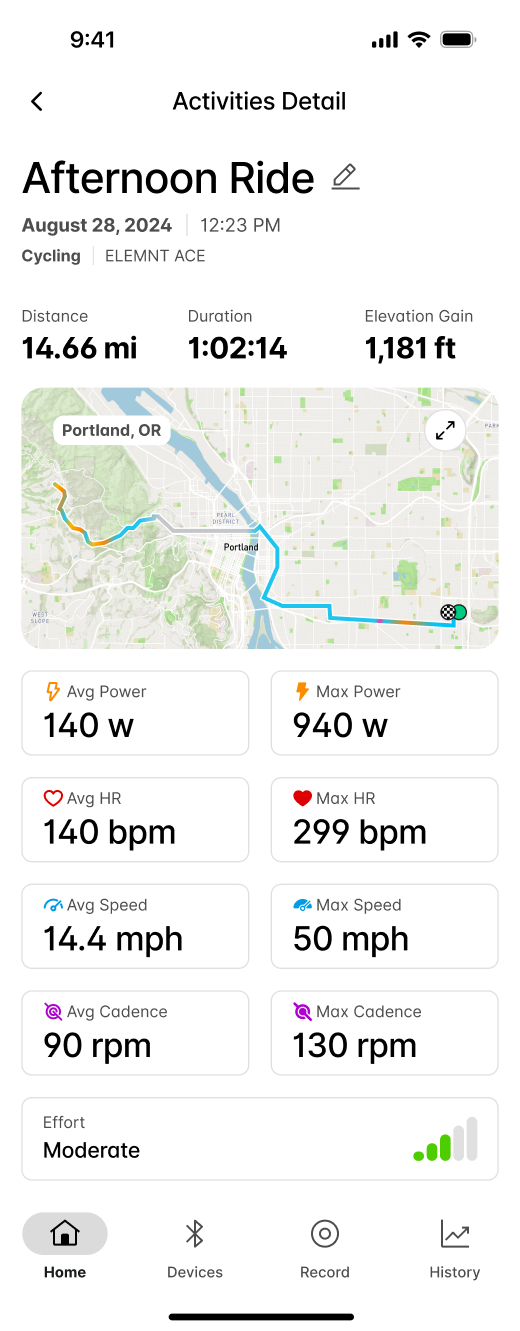
A clearer recap at the top. Depth, right below it.
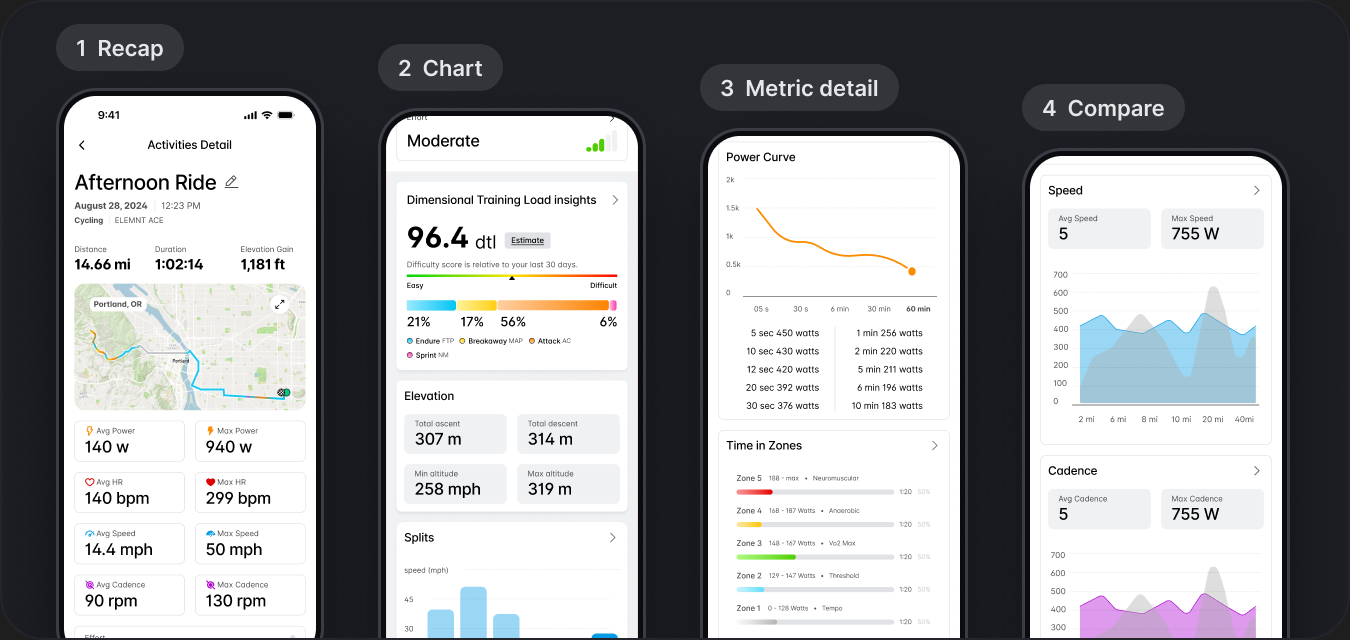
The redesign reads as one surface with three layers: a recap that answers "how was my workout?" at a glance, a chart layer that invites exploration, and a comparison layer that lets users see this ride against the last ten.
1 · Problem
The screen users wanted to love but kept skipping
The legacy Activity Details screen was functional but dated. Metrics were stacked in equal-weight tiles, charts lived two taps deep, and the first-open experience looked identical whether you'd just finished a workout or opened the app a week later.
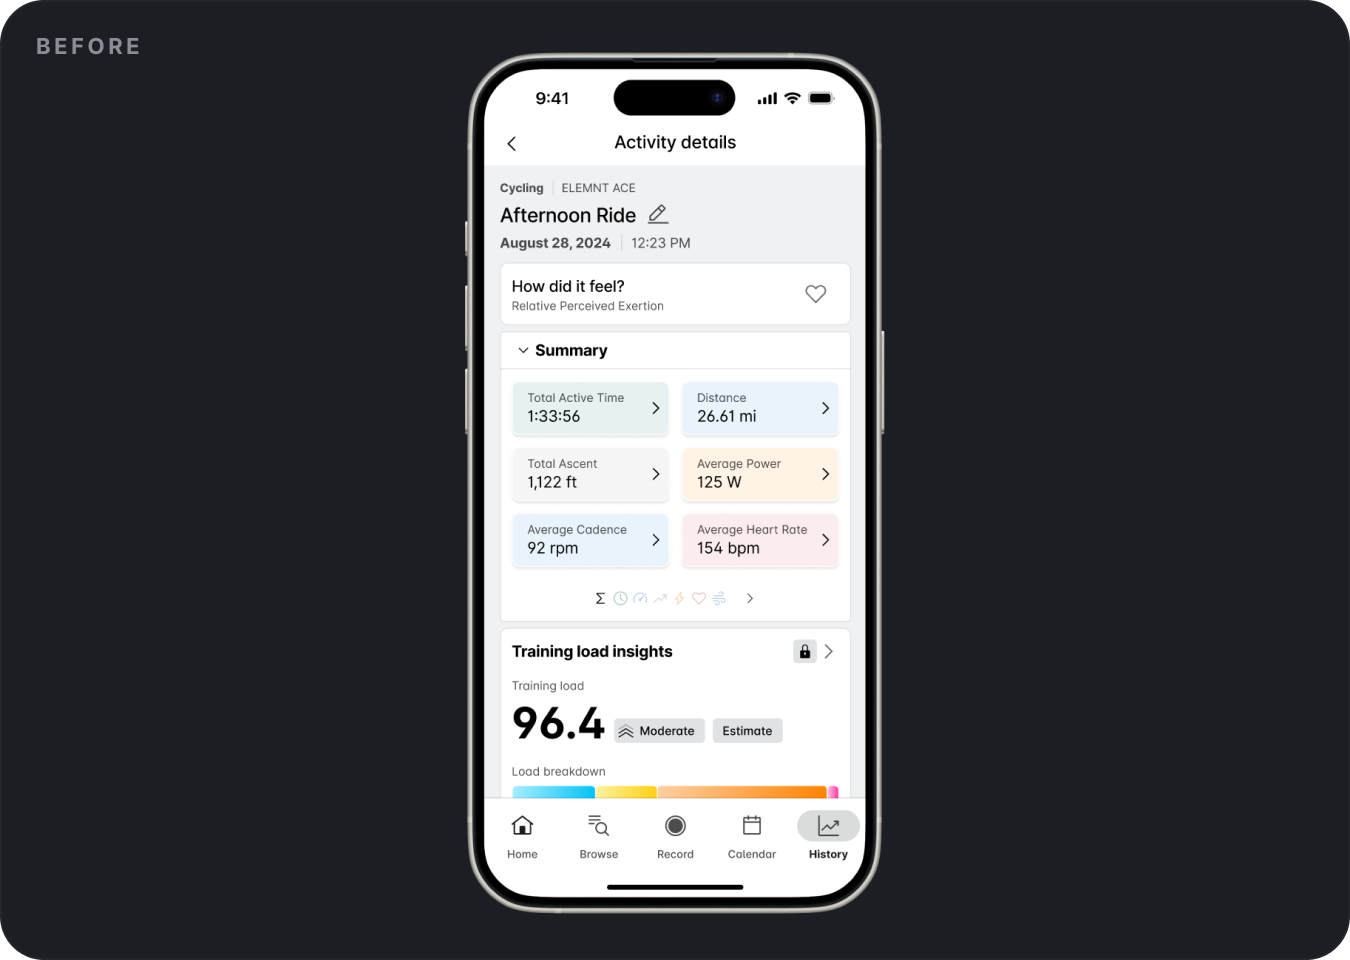
At the same time, the business was moving toward a more app-centric strategy. Activity data had the potential to be both a daily-value feature (open the app to see your workout) and a stronger premium touchpoint (deeper insights behind the Pro paywall).
The challenge
Create a post-workout experience that feels clear enough for casual users and deep enough for athletes who want more - without forcing either group through the other's screen.
2 · Decisions
Three directions, one that survived
The most consequential question wasn't which chart. It was how much data to show immediately versus how much to defer. Treat the surface as a dashboard and you overwhelm casual users; treat it as a greeting card and you drive athletes away.
Option A
Full dashboard on first open
All metrics visible at once. Scored well with power users in team review; casual users dropped off before the fold in tap-tests.

Option B
Minimal recap with a separate detail screen
Cleaner first impression, but shifted every deeper interaction into a second navigation step. Lost the browsing behavior research had identified as a core return reason.
Option C
Chosen
Progressive depth on one surface
A legible top-line recap, then charts below the fold as a natural entry into deeper exploration. Supported both audiences on the same screen without forcing a mode switch.

Option C won because it respected both behaviors without duplicating the experience, and because research showed users already scrolled past the fold when they wanted more - the design just made that path intentional.
3 · The system
Four layers that worked together
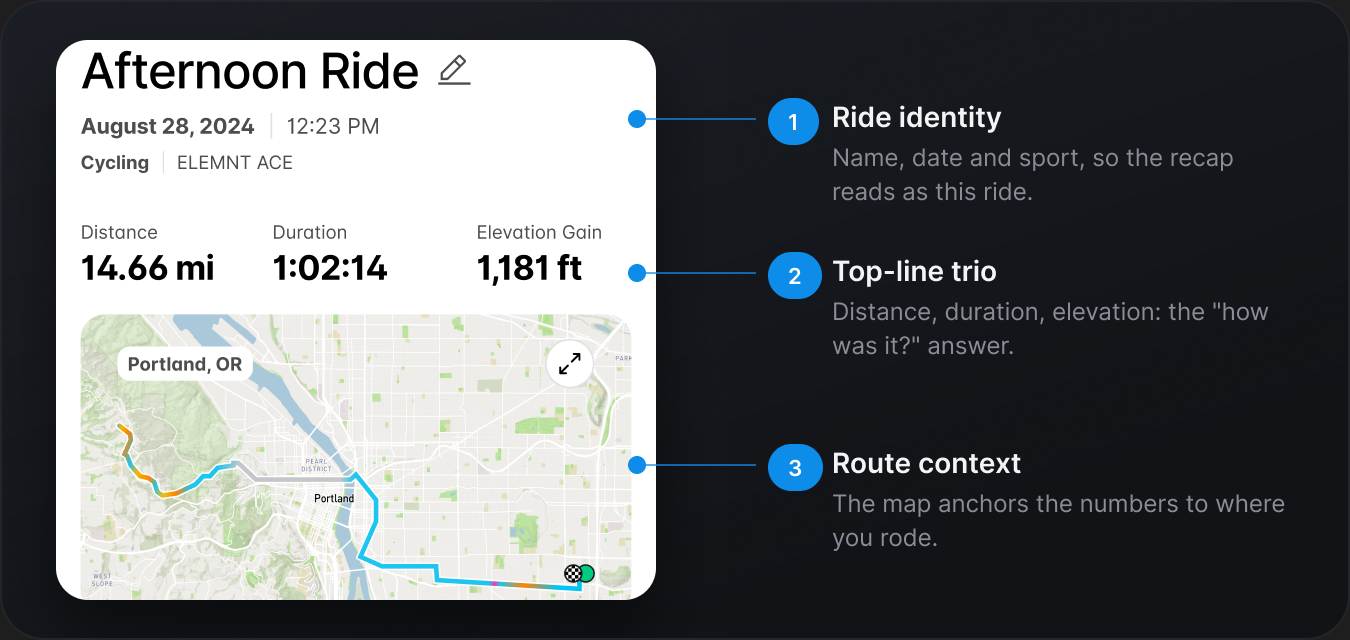
1. A clearer recap
I redesigned the recap layer to feel faster, cleaner, and easier to understand. The new structure emphasized top-line metrics first, giving users a concise summary of the workout before introducing deeper views.
2. A more intentional return moment
I introduced a first-open post-workout experience that recognized when a user returned to the app after finishing a session. Instead of dropping users back into the product without context, the app treated that return as a meaningful moment. We added prompts like "How did that workout feel?" to support quick reflection.
3. Charts as the doorway to depth
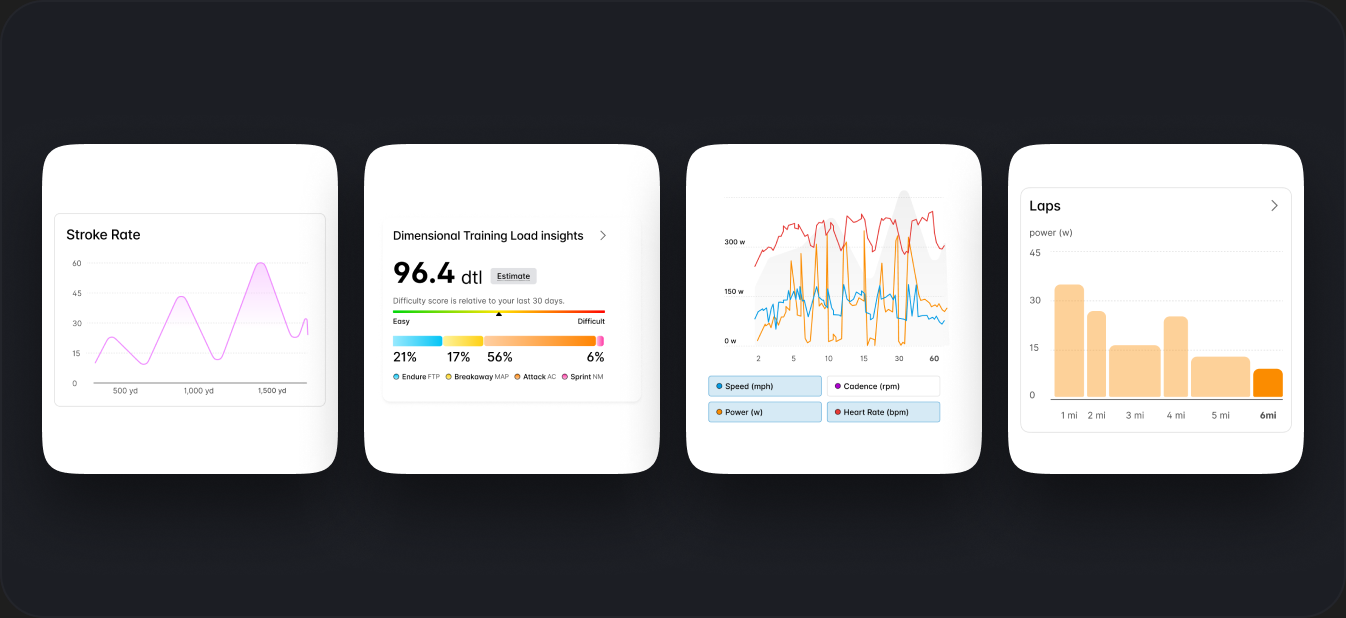
Charts became a central part of the redesign, but they were placed deliberately below the fold. This is where users tended to spend more time once they moved beyond the recap, so charts became the entry point into deeper exploration and past-workout comparison.
4. Progressive depth
A core design decision was to separate entry point from exploration. The surface experience focused on high-level understanding. Deeper layers supported users who wanted to inspect more nuanced metrics or compare performance over time.
4 · The journey
From workout end to insight, in under a minute
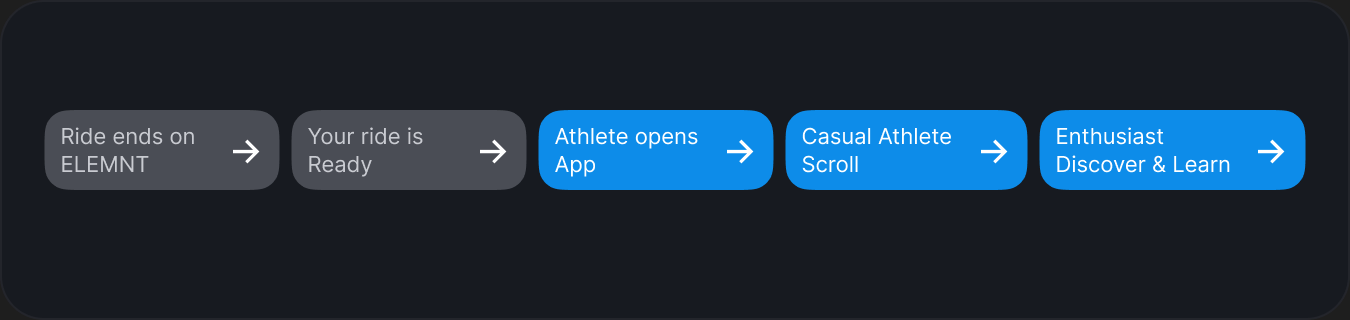
The redesign is less about any single screen and more about the arc. From the moment a user ends a ride on their head unit to the moment they close the app with a sense of "that was a good one" - every step was tuned.
5 · Details
Getting it right beyond the happy path
A few of the moments that didn't make the keynote slide, but shaped how the experience actually felt.
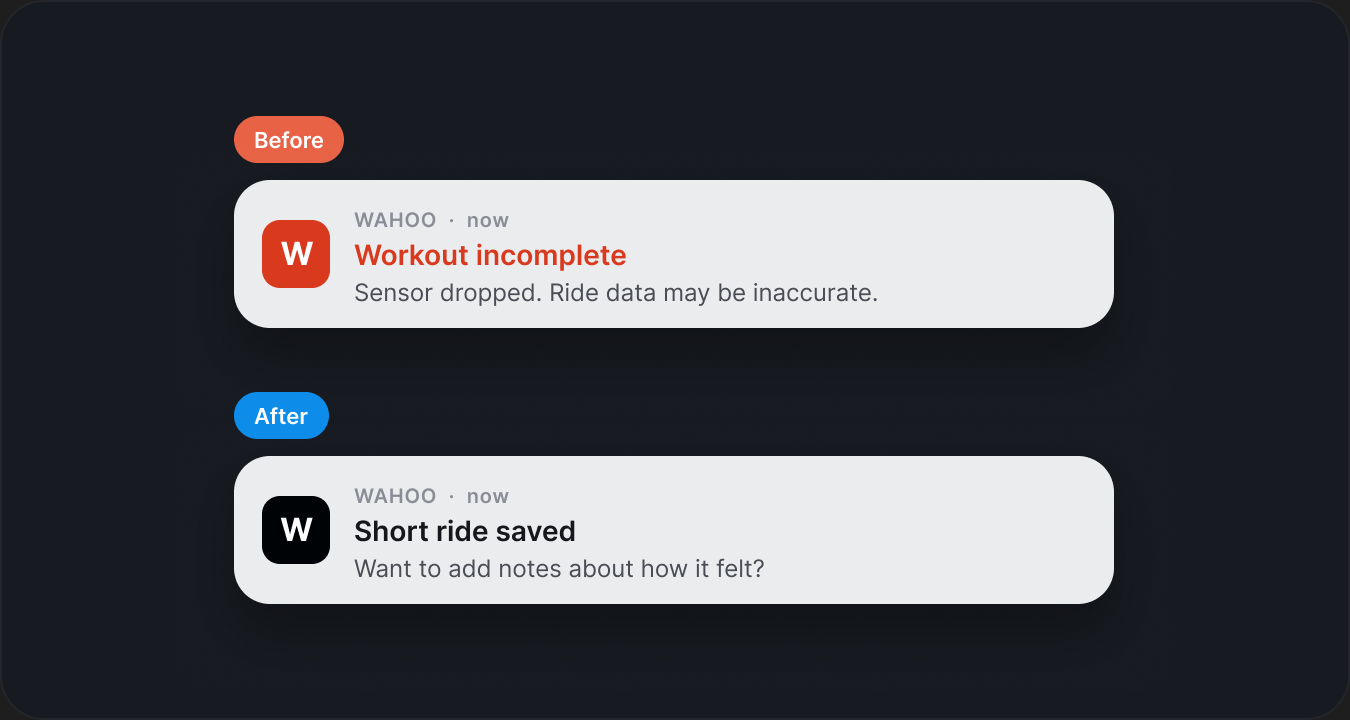
Soft miss on a workout
Early versions of post-ride notifications felt too abrupt when something was off - a dropped sensor, a short session. I dialed those moments back so the tone stayed supportive instead of punitive.
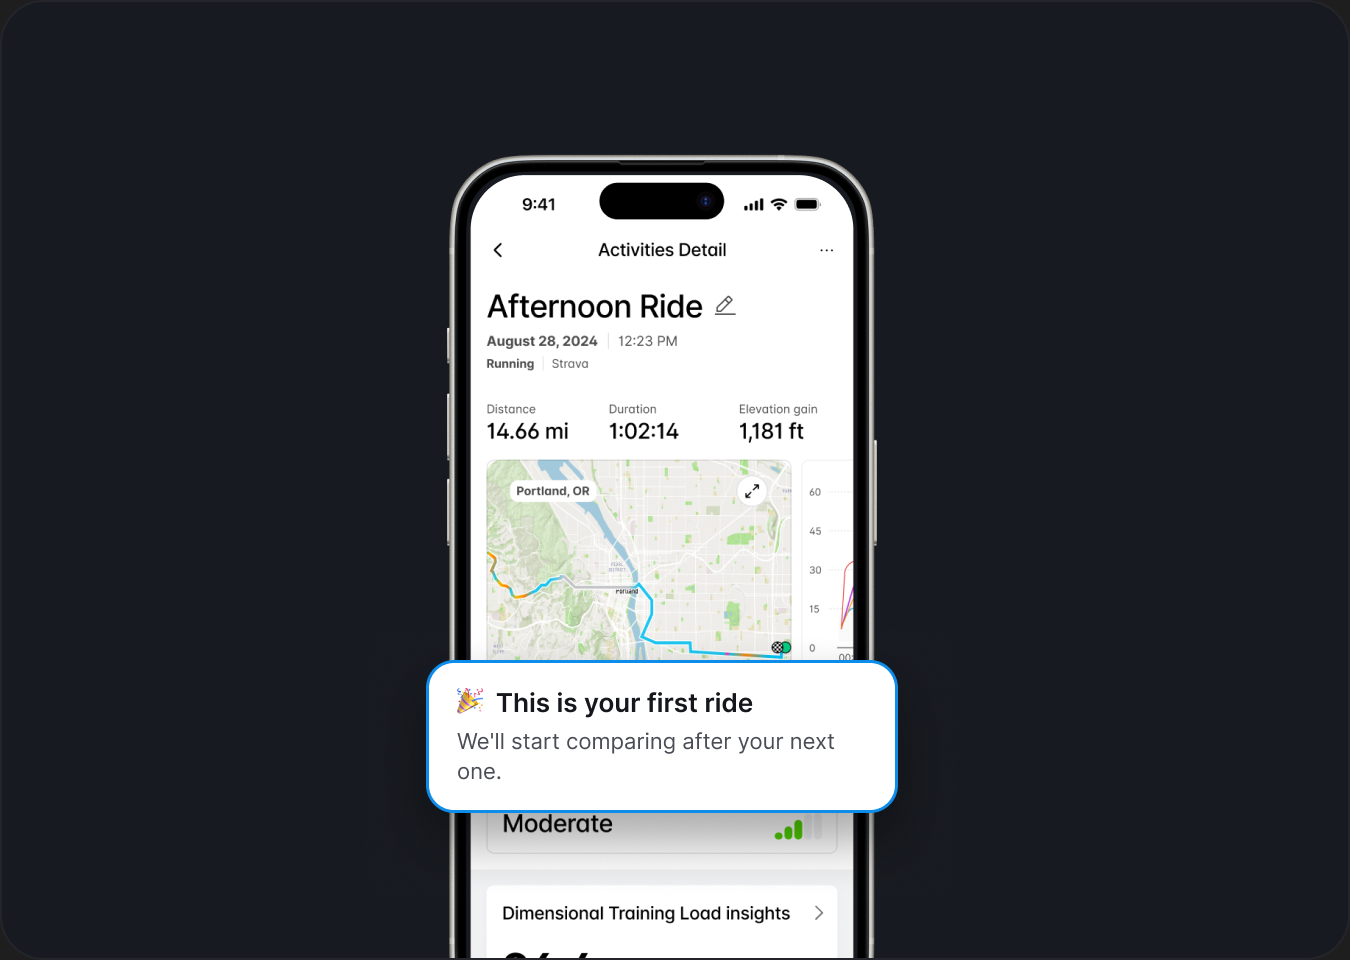
First-ride users
With no history, comparison views have nothing to compare against. The empty state had to still feel like a recap, not a prompt to "ride more."
Thanks for reading
If you'd like to talk about this project, the decisions behind it, or anything else in the portfolio, drop me an email .